by Steve Tilson
June 20, 2017

Detecting unusual or anomalous network behavior is impossible without first establishing a baseline of network activity for comparison. NetFlow is a network protocol for collecting IP traffic information and monitoring network traffic. Routers and switches that support NetFlow can collect IP traffic statistics on all interfaces where NetFlow is enabled. The network devices then export the statistics as NetFlow records to Tenable Log Correlation Engine (LCE). By analyzing the traffic collected in LCE with Tenable NetFlow, a picture of network traffic flow and volume can be built.
Tenable NetFlow Monitor (TFM) is a powerful tool for developing an audit trail of what has happened within a network. Monitoring NetFlow data complements packet capture activities well, enabling a more thorough picture of traffic to be created over time. A healthy network is critical to all organizations and administrators should monitor and maintain an efficient network. Being able to identify hosts that are creating or receiving traffic, whether authorized or unauthorized, assists administrators in making decisions about prioritization of resources and necessary changes to the network. Analysis of data gathered by TFM may help administrators identify misconfigured devices, data exfiltration, scans from outside sources, denial of service attacks and compromised hosts. In addition to issues listed, unchecked traffic can create issues for organizations by consuming valuable bandwidth unnecessarily. Administrators can also use this information for network expansion analysis by monitoring subnet traffic.
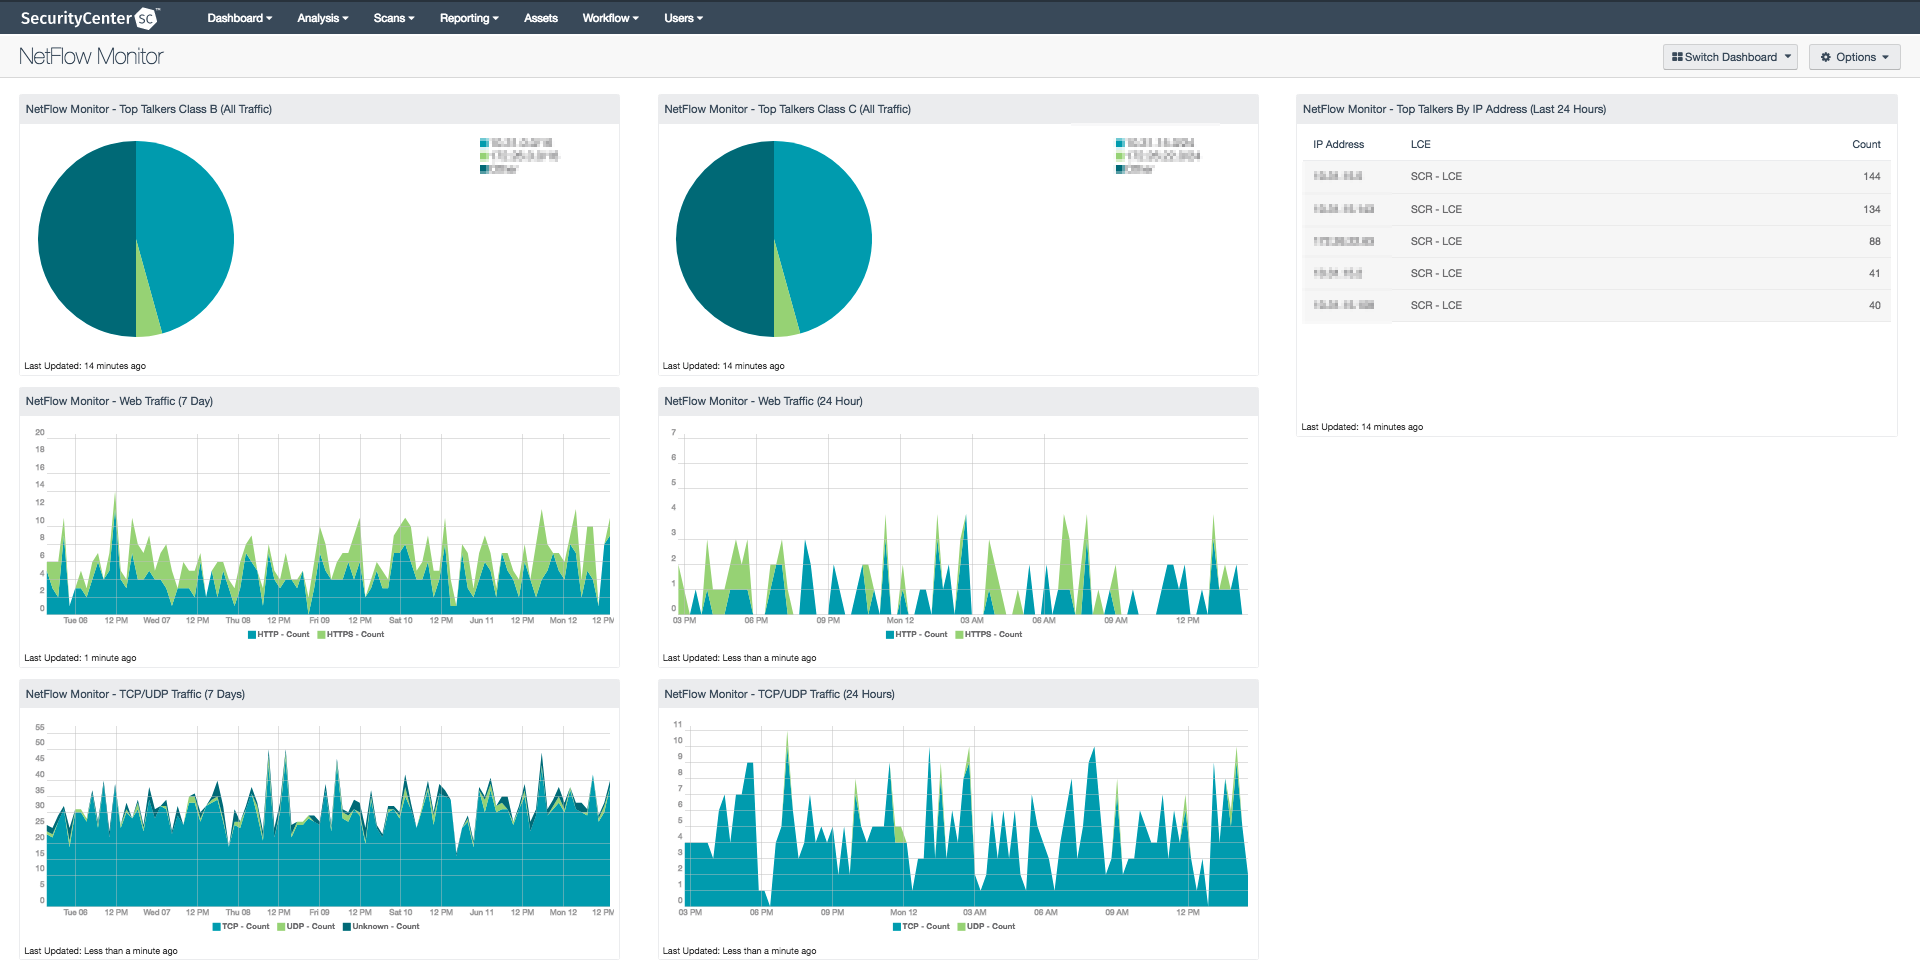
This dashboard displays event statistics that leverage the capabilities of TFM and normalized events by LCE. This event data is correlated to produce a series of pie charts, tables and trend charts. Analysts can use this dashboard to consistently monitor network traffic and to analyze the health of the network once a baseline is obtained.
The dashboard and its components are available in the SecurityCenter Feed, a comprehensive collection of dashboards, reports, Assurance Report Cards and assets. The dashboard can be easily located in the SecurityCenter Feed under the category Monitoring.
The dashboard requirements are:
- SecurityCenter 5.4.5
- LCE 5.0.1
- Tenable NetFlow Monitor
Tenable SecurityCenter Continuous View (SecurityCenter CV) provides continuous network monitoring, vulnerability identification and security monitoring. SecurityCenter CV is continuously updated with information about advanced threats, zero-day vulnerabilities and new types of regulatory compliance configuration audit files. Tenable constantly analyzes information from our unique sensors, delivering continuous visibility and critical context, and enabling decisive action that transforms a security program from reactive to proactive. Leveraging Tenable LCE, as well as the NetFlow Monitor and Network Monitor clients provide analysis for determining network efficiency and security. Tenable enables powerful, yet non-disruptive, continuous monitoring of the organization to ensure all events are monitored and captured for analysis of the network traffic.
The components in this dashboard include:
Top Talkers Class B (All Traffic): This component presents the analyst with a pie chart referencing the Top 5 talkers filtered by Class B address space, providing a visual representation of address space utilizing the most bandwidth over the last 24 hour reporting period.
Top Talkers Class C (All Traffic): This component presents the analyst with a pie chart referencing the Top 5 talkers filtered by Class C address space, providing a visual representation of address space utilizing the most bandwidth over the last 24 hour reporting period.
Top Talkers by IP Address (Last 24 Hours): This component presents the analyst with a table referencing the Top 5 talkers filtered by specific IP address, providing a visual representation of the top talking IP addresses along with a packet count over the last 24 hour reporting period.
Web Traffic (7 Day/24 Hour/1 Hour): This component presents the analyst with a graphical representation and trending for HTTP vs. HTTPS over the specified timeframe. This provides a fast method to conduct visual trend analysis of specific protocols.
TCP/UDP Traffic (7 Day/24 Hour/1 Hour): This component presents the analyst with a graphical representation and trending for TCP vs. UDP over the specified timeframe. This provides a fast method to conduct visual trend analysis of specific protocols.