by Josef Weiss
Security practitioners need full visibility of all vulnerabilities within the organization. By leveraging the continuous asset scanning and automated risk prioritization capabilities of Tenable Security Center (formerly Tenable.sc), the practitioner is able to discover operating system and application instances, software vulnerabilities, misconfigurations and other exposure details. This dashboard provides a high-level summary of asset counts per operating system and discovered applications, with the added benefit of helpful queries to identify troublesome areas in scan fidelity.
A key first step in establishing an exposure management program is to separate findings by operating systems and applications. This discovery process helps to assess the technology in the environment and discover gaps in exposure management. The components in the dashboard focus on either operating system vulnerabilities or application vulnerabilities by leveraging the CPE (Common Platform Enumeration) strings that are defined by NIST (National Institute of Standards and Technology) and provide a unique, standardized name for IT products. Using this comprehensive approach to data analysis, the risk manager is able to obtain visibility into the network and prioritize mitigation efforts accordingly.
Once the vulnerabilities are known to the risk managers the risk prioritization begins. In cases where a vendor supplied patch is available, patch management solutions are able to increase efficiency by distributing and applying the patches. However, there are many cases where unsupported operating systems or patches have not been released yet. Oftentimes unpatchable vulnerabilities are identified as exploitable, and to remediate the risk requires a configuration change such as a registry key change, disabling insecure or deprecated protocols, and upgrading to a supported operating system version or new operating system.
As the exposure management program matures, the security operations team needs to begin to measure data collection and the remediation processes. To allow for accurate measurements, the fidelity of the scanning program needs to be reviewed and monitored. To assist in this process the dashboard has several components that enable the understanding of scan health by identifying gaps in the scan activities. Organizations that utilize both agent scans and network scans are able to benefit from each method and begin to close the gaps in scan coverage. The dashboard helps to show the health of credentialed network scan, also known as an authenticated scan (which provides a deeper insight into the risk posture of the asset), as compared to discovery scanning. If credentialed network scans are not available, the organization can leverage the Tenable Agent to collect vulnerability data. While agents are not designed to perform network checks, certain settings cannot be checked or obtained, therefore combining network scans with agent-based scanning eliminates this gap. The key thing to keep in mind is that scanning with credentials will provide the best and most complete asset info, vulnerability and patch auditing picture with a regular scanning cadence and depth. Local Check Scans with the Tenable Agent or working credentials will provide the more complete and hi-fidelity data set that is needed and ensure the good data passes downstream for reporting, workflows and stakeholders.
Tenable Security Center provides the ability to Know the vulnerabilities on the network and provides full visibility with continuous asset scanning and automated risk prioritization capabilities. The data on this dashboard helps to Expose gaps and facilitate the process in which the risk manager is able to quickly find highly exploitable, business-impacting vulnerabilities using risk-based threat intelligence and critical asset identification. As the risk mitigations efforts increase their affection, the CISO is able to Close the critical exposures and make rapid, decisive decisions that direct actions to mitigate high-risk vulnerabilities and communicate leadership and stakeholders as the current state of the exposure management program.
Components
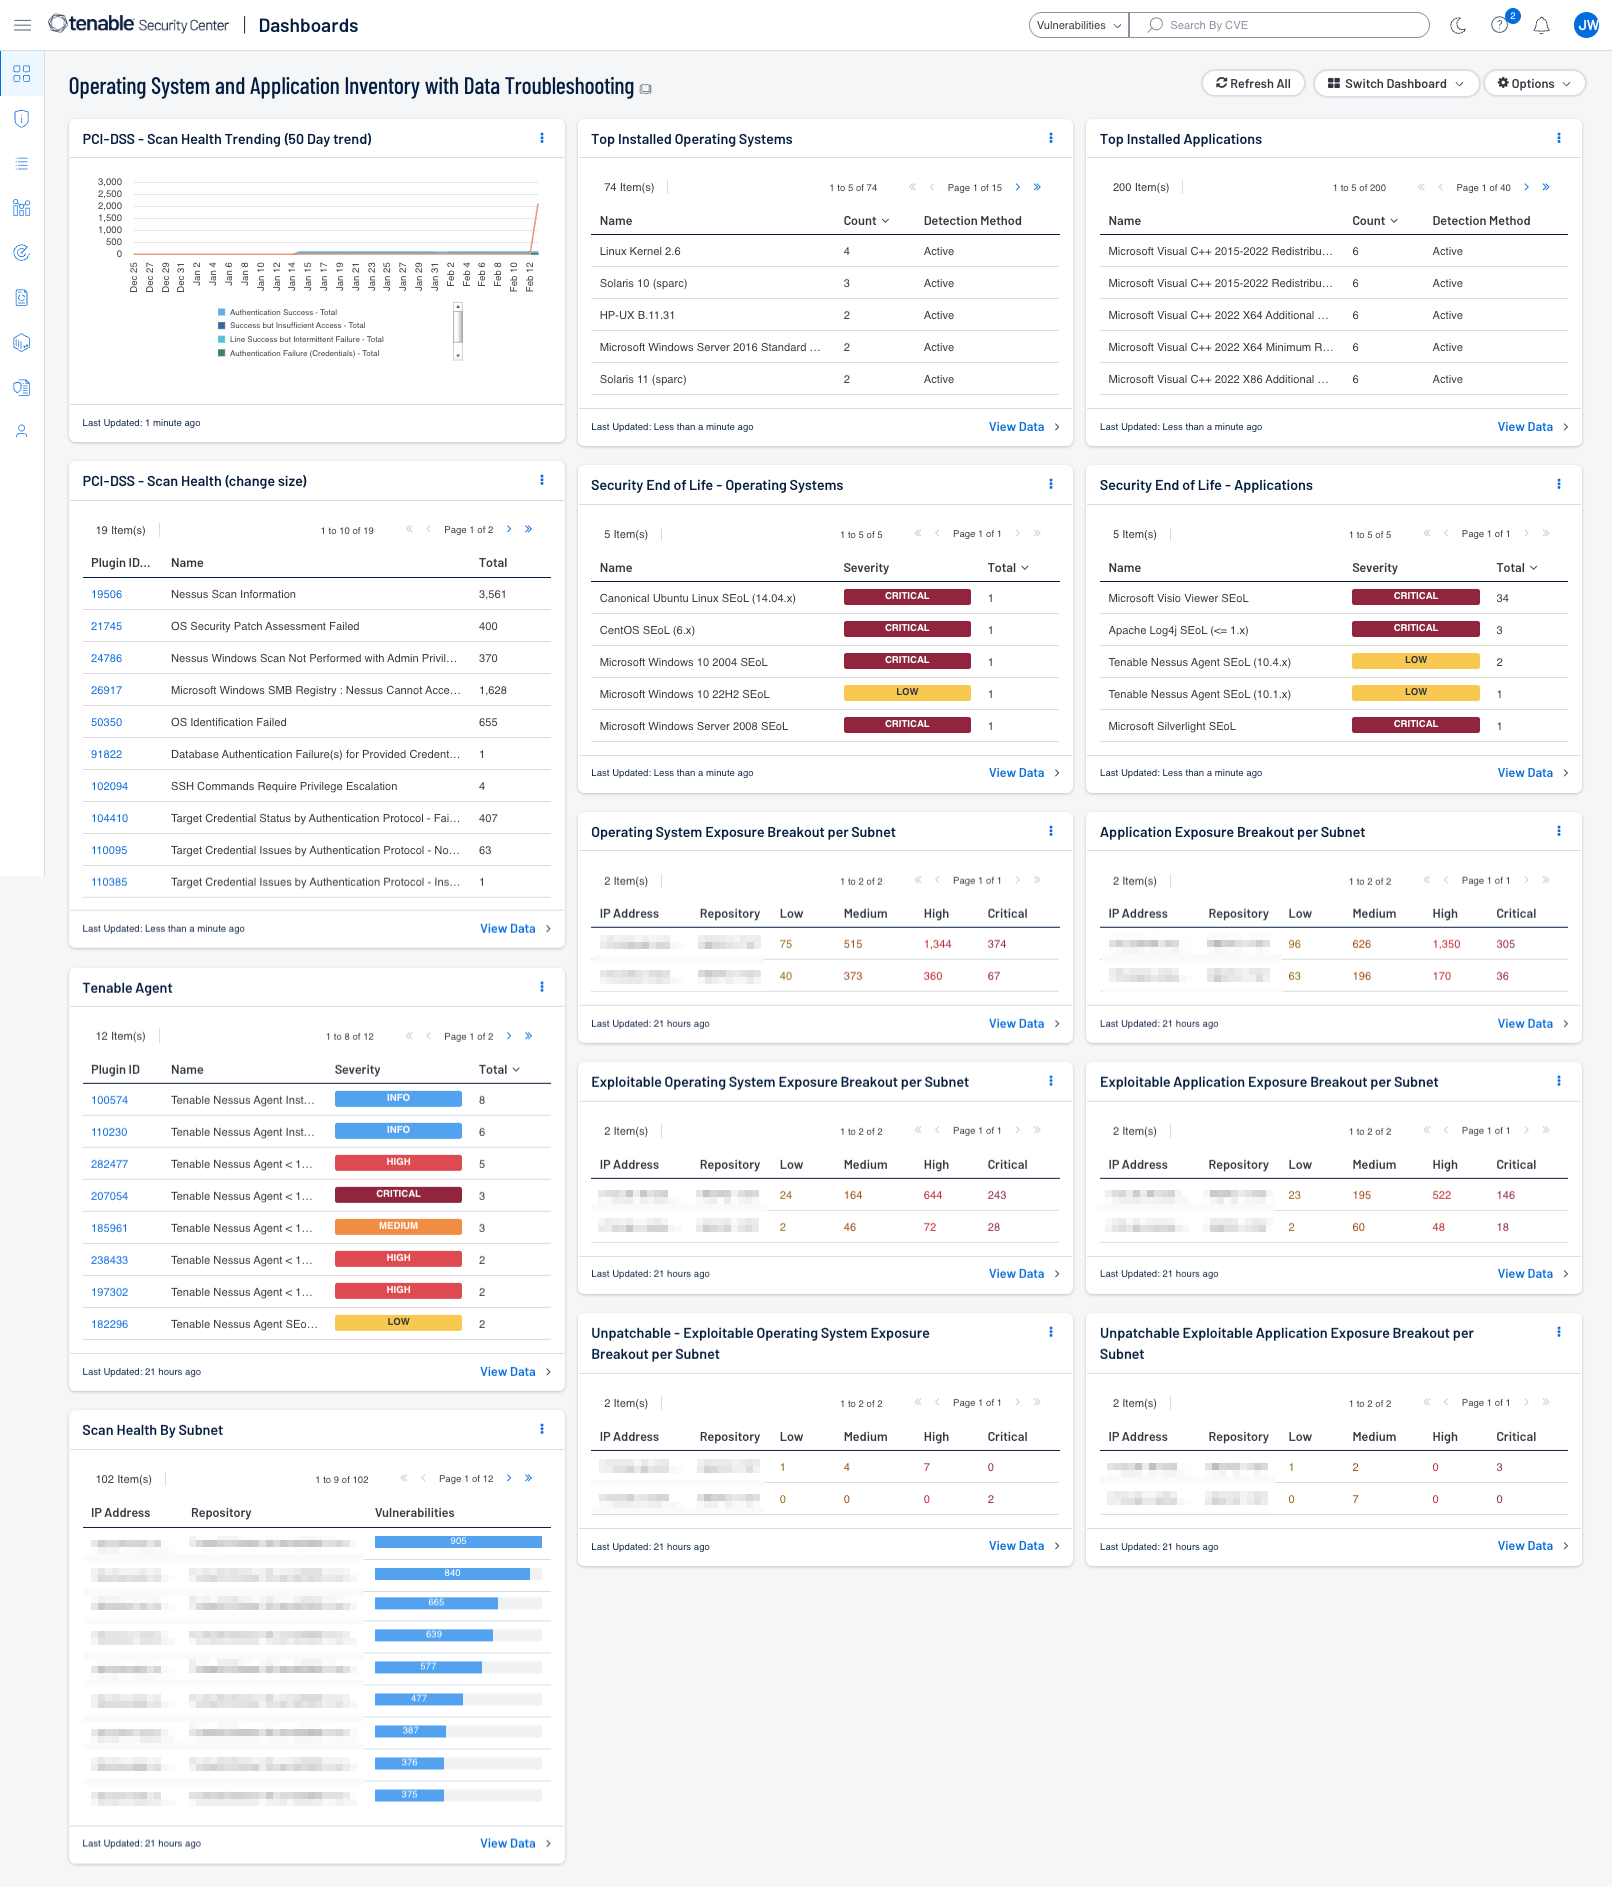
- PCI-DSS - Scan Health Trending (50 Day trend) - This chart provides a trend analysis about authentication status and the scan process.
- PCI-DSS - Scan Health - The Scan Health component provides details about authentication status and the scan process.
- Tenable Agent - This table provides details related to Tenable Agents. Details include informational data, such as the detection of Tenable Agent installations, as well as Tenable Agent vulnerability data, such as out-of-date or software end-of-life (SEoL) Tenable Agents, including potential third-party induced vulnerabilities to Tenable Agents from products such as OpenSSL.
- Scan Health By Subnet - The Scan Health component provides a summary about authentication status and the scan process per subnet.
- Top Installed Operating Systems - The table provides a list of operating systems detected over the last 30 days by using Nessus, Tenable Agent or Nessus Network Monitor.
- Security End of Life - Operating Systems - The Security End of Life - Operating Systems table displays all SEoL operating systems, associated severity, and is sorted by count.
- Operating System Exposure Breakout per Subnet - The table provides a list of operating system vulnerabilities by subnet, detected over the last 30 days by using Nessus, Tenable Agent or Nessus Network Monitor.
- Exploitable Operating System Exposure Breakout per Subnet - The table provides a list of operating system exploitable vulnerabilities by subnet, detected over the last 30 days by using Nessus, Tenable Agent or Nessus Network Monitor.
- Unpatchable - Exploitable Operating System Exposure Breakout per Subnet - The table provides a list of operating system exploitable vulnerabilities by subnet which do not have a patch published, detected over the last 30 days by using Nessus, Tenable Agent or Nessus Network Monitor.
- Top Installed Applications - The table displays the vulnerabilities related to applications last observed over the last 30 days, displays the plugin name and count of found on the network.
- Security End of Life - Applications - The Security End of Life - Applications table displays all SEoL applications, associated severity, and is sorted by count.
- Application Exposure Breakout per Subnet - The table provides a list of application vulnerabilities by subnet, detected over the last 30 days by using Nessus, Tenable Agent or Nessus Network Monitor.
- Exploitable Application Exposure Breakout per Subnet - The table provides a list of exploitable application vulnerabilities by subnet, detected over the last 30 days by using Nessus, Tenable Agent or Nessus Network Monitor.
- Unpatchable Exploitable Application Exposure Breakout per Subnet - The table provides a list of exploitable application vulnerabilities by subnet which do not have a patch published, detected over the last 30 days by using Nessus, Tenable Agent or Nessus Network Monitor.
Tenable One
Request a demo
The world’s leading AI-powered exposure management platform.
Thank You
Thank you for your interest in Tenable One.
A representative will be in touch soon.
Form ID: 7469
Form Name: one-eval
Form Class: c-form form-panel__global-form c-form--mkto js-mkto-no-css js-form-hanging-label c-form--hide-comments
Form Wrapper ID: one-eval-form-wrapper
Confirmation Class: one-eval-confirmform-modal
Simulate Success